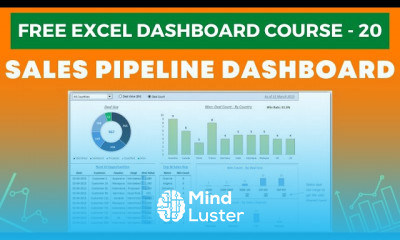
How to Create a Stunning Interactive Dashboard in Excel Sales Excel Dashboard Crash Course
Share your inquiries now with community members
Click Here
Sign up Now
Lesson extensions
Lessons List | 13
Lesson
Comments
Related Courses in Computer Softwares
Course Description
Creating microsoft excel Pivot course,
in this course you'll delve into the intricacies of creating dynamic and interactive pivot tables in Excel. Learn how to summarize and analyze large datasets efficiently, extract meaningful insights, and present information visually using pivot tables. From basic pivot table creation to advanced techniques like grouping, filtering, and calculated fields, this course covers everything you need to know to harness the full power of pivot tables in Excel. Whether you're a beginner or looking to enhance your skills, join us as we explore the ins and outs of creating pivot tables in Microsoft Excel. Let's dive in and unlock the potential of pivot tables to revolutionize your data analysis workflows.
Trends
Graphic design tools for beginners
Artificial intelligence essentials
Essential english phrasal verbs
Microsoft Excel
Build a profitable trading
Human heart structure
Python for beginners
Making money with apps
French
Learning English Speaking
Electrical engineering for engineer
Human Resources Management
American english speaking practice
Excel skills for math and science
MS Excel
Computer science careers
Compiler Design Principles
Build a tic tac Toe app in Xcode
Network analysis Ankit goyal
Python programming language
Recent
Parasite structure
Bacterial cell culture
Virus structure
Photosynthesis experiments
Structural Pathway of glycolysis
Human heart structure
Carbohydrates
Biostatistics
Immunofluorescence assay
Plant biotechnology
Microscopy types for beginners
Immunoglobulin structure
Fermentation process
r DNA technology
Animal biotechnology fundamentals
Amino Acid metabolism
Cell membrane structure
Gas chromatography
Pituitary gland structure and function
Industrial biotechnology


