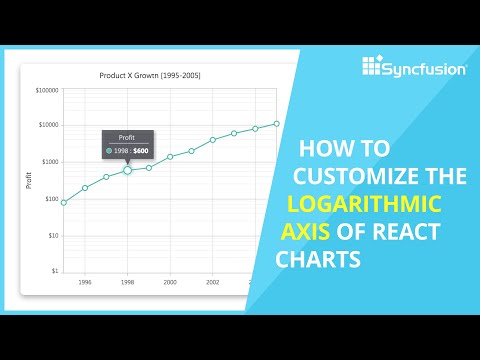
How to Customize the Logarithmic Axis in React Charts
Share your inquiries now with community members
Click Here
Sign up Now
Lessons List | 11
Lesson


Comments
Our New Certified Courses Will Reach You in Our Telegram Channel
Join Our Telegram Channels to Get Best Free Courses
Join Now
We Appreciate Your Feedback
Be the First One Review This Course
0 Reviews
Related Courses in Programming


Course Description
Google Charts is a free Javascript library that allows you to visualize data in many types of charts and graphs. It's very useful and easy to use in your projects. In this tutorial, we'll see how to use Google Charts in React by creating a simple React app with Create React App (CRA).
Trends
Excel Course Basic to Advanced
Loading Android Programming
MySQL Installation Fundamentals
Learning English Speaking
Complete WIFI Hacking Course Beginner to Advanced
MS Excel
Digital Marketing
Artificial Intelligence
The Complete Python Programming Full Course
Embedded Systems ES
Canva Pro
Leadership Concepts
WiFi hacking
SOFTWARE TESTING
Graphics in c
HTML CSS JavaScript
Graphics in C programming
Python in Hindi
Python programming language
Mobile Apps from Scratch
Recent
Warm Up workout at gym
Glute ankle weight workouts at home
Arms and shoulders workout with dumbbells
Squat and lunge workout at home
Glutes and hamstrings workout at home
Glutes and lower abs workout at home
Isometric Leg workout at home
Leg workout with dumbbells at home
Glute workout with ankle weights
Full body circuits workout at gym
Dumbbell chest workouts at home
Dumbbell shoulders workout at Home
Bodyweight core and abs workout at home
Push ups and abs workout at home
Push Ups workout at home
Bodyweight Legs workouts at home
Dumbbell upper body workout at home
Dumbbell full body cardio workout
Dumbbell Abs and Core workout at home
Isometric full body workout at home