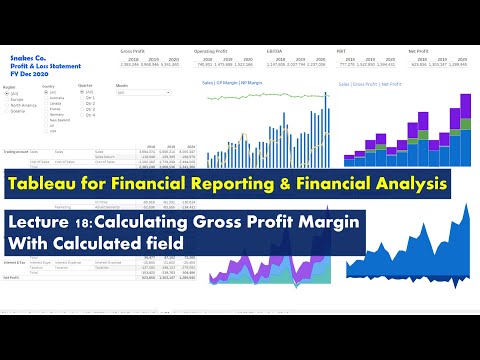
Lecture 18 Calculating Gross Profit Margin with Calculated field Course Tableau for FA FR
Share your inquiries now with community members
Click Here
Sign up Now
Lesson extensions
Lessons List | 29
Lesson
Comments
Our New Certified Courses Will Reach You in Our Telegram Channel
Join Our Telegram Channels to Get Best Free Courses
Join Now
We Appreciate Your Feedback
6 Reviews

Manthan Patel

Abeer Anwar

Tatenda Mutombwa
ASSOUMOU MOTO Ulex Charlan
Show More Reviews
Related Courses in Accounting

Course Description
Tableau for financial reporting course,
in this course we will learn about Tableau for financial reporting. You'll explore how to leverage Tableau’s powerful data visualization tools to transform complex financial data into clear, insightful reports and dashboards. The course covers key techniques for creating interactive financial reports, including building dynamic dashboards, visualizing key financial metrics, and integrating data from multiple sources. You’ll also learn how to automate the reporting process, ensuring that financial insights are always up-to-date and accessible. By mastering Tableau’s features, you’ll be able to present financial information in a way that enhances decision-making and supports strategic planning. This course is ideal for finance professionals, analysts, and anyone looking to improve their financial reporting skills using Tableau.
Trends
MS Excel
Learning English Speaking
Python for data science and AI
Python programming language
English greetings and responses
Excel Course Basic to Advanced
Web development with Java spring
AI fundamentals for beginners
Excel skills for busines intermediate
Creating bitmap images from scratch
AI with IBM Watson
Communication Skills
Video editing with adobe premiere
Digital Marketing Beginners
Web Design for Beginners
Photo Editing
UX design foundations for beginners
Online digital marketing from home
Digital media and marketing strategies
ISTQB advanced test analyst 2024
Recent
ISTQB advanced test analyst 2024
ISTQB exam registration guide
ISTQB test automation engineer certification
ISTQB agile technical tester 2024
ISTQB technical test analyst 2024
ISTQB mobile application tester 2024
ISTQB performance testing fundamentals
ISTQB test manager certification
ISTQB automotive software tester 2024
ISTQB certification in software testing
ISTQB foundation certification questions
Software testing bootcamp for beginners
ISTQB AI tester
ISTQB test automation engineer v2 0 exam
ISTQB foundation level exam practice
ISTQB Foundation level exam
ISTQB Agile tester practice questions
Health benefits of swimming
Swimming basics for beginners
breathe while swimming for swimmers