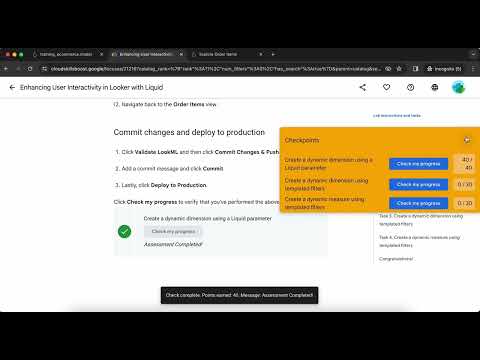
Creating Tile based Dashboard Alerts in Looker GSP1160
Share your inquiries now with community members
Click Here
Sign up Now
Lesson extensions
Lessons List | 20
Lesson
Comments
Our New Certified Courses Will Reach You in Our Telegram Channel
Join Our Telegram Channels to Get Best Free Courses
Join Now
We Appreciate Your Feedback
Be the First One Review This Course
0 Reviews
Related Courses in Computer Science


Course Description
Creating reports in looker studio course,
in this course we will learn about Creating Reports in Looker Studio, focusing on the essential techniques for designing and building interactive, visually compelling reports using Looker Studio. Looker Studio is a powerful data analytics and visualization platform that allows users to transform raw data into meaningful insights through custom reports and dashboards.
The course covers key topics such as connecting to various data sources, exploring and analyzing data, and utilizing Looker Studio's robust visualization tools to create charts, graphs, and tables that effectively communicate your findings. You will also learn how to customize reports with filters, themes, and calculated fields, making the reports both informative and tailored to your audience's needs.
Additionally, the course will guide you through best practices for sharing and collaborating on reports, ensuring that your data-driven insights are easily accessible to stakeholders across your organization. Whether you are looking to create performance dashboards, marketing reports, or financial summaries, this course will equip you with the skills to leverage Looker Studio for all your reporting needs.
Trends
Learning English Speaking
Pattern background design in illustrator for beginners
WiFi hacking
Adobe illustrator tools for designers
Data Structure
Ethical Hacking
Excel Course Basic to Advanced
Python programming language
Mobile Apps from Scratch
On Reinforcement Learning with Python
python programming
MS Excel
Communication Skills
Embedded Systems ES
Graphic design rules for beginners
Basic Mathematics by Serge Lang
Digital Marketing Beginners
Complete WIFI Hacking Course Beginner to Advanced
The Complete Python Programming Full Course
Data Structures and Algorithms
Recent
Adobe illustrator tools for designers
Graphic design rules for beginners
Isometric design in illustrator for beginners
Psychology in graphic design for beginners
Test graphic design skills for beginners
Plugins for adobe Illustrator designers
Logo design tools in illustrator for beginners
Illustrator keyboard shortcuts for beginners
Building graphic design portfolio from scratch
Audacity download and installation for beginners
Downloading and installing tux paint for kids
Building a race game in scratch for beginners
Sharing links in edmodo for beginners
Google sheets dynamic chart techniques
Building a CV website from scratch
Designing logos in google drawings for beginners
Converting PDF to google docs for beginners
Google slides text masking essentials
Inserting images in microsoft word for beginners
Hosting images on google drive for beginners