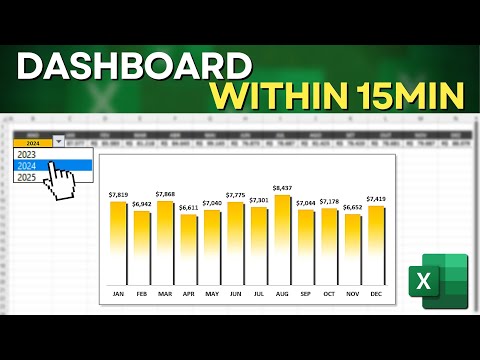
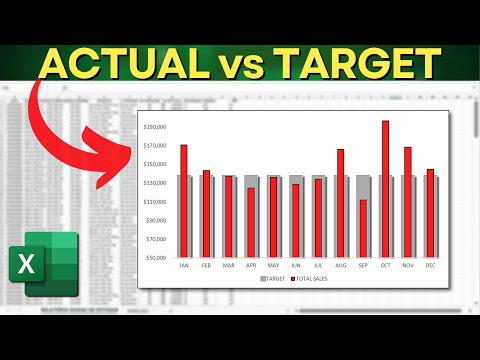
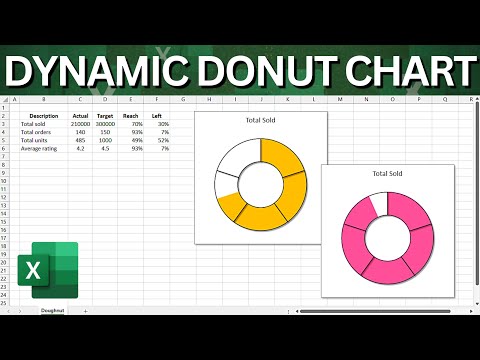
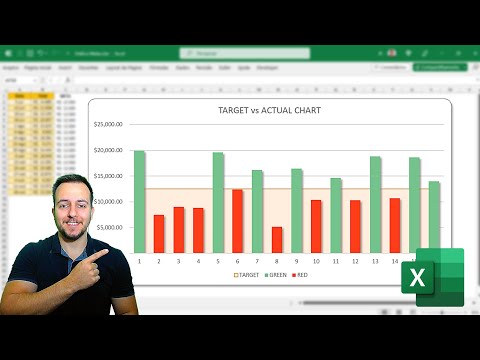
How to Make a Actual vs Target Chart in Excel SumIF Function From Dataset to the Chart
Share your inquiries now with community members
Click Here
Sign up Now
Lesson extensions
Lessons List | 13
Lesson

Comments
Our New Certified Courses Will Reach You in Our Telegram Channel
Join Our Telegram Channels to Get Best Free Courses
Join Now
We Appreciate Your Feedback
Be the First One Review This Course
0 Reviews
Related Courses in Computer Softwares


Course Description
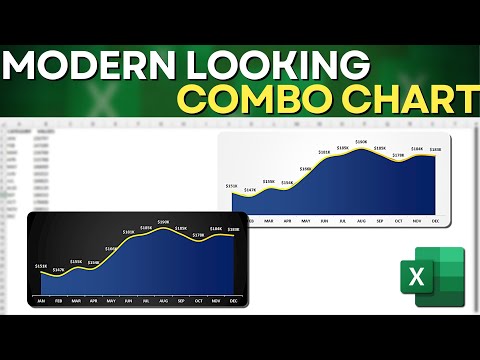
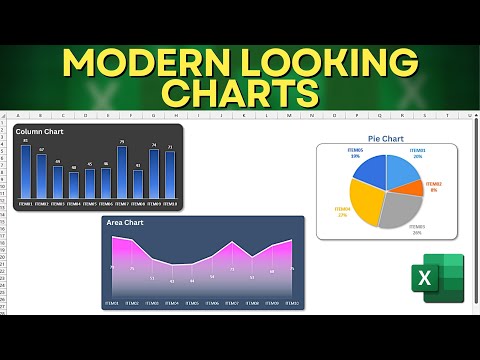
Combining charts in excel course,
in this course we will explore the techniques for counting colored cells in Excel, a valuable skill for visually analyzing and categorizing data. Starting with the basics, we will cover how to utilize built-in Excel functions alongside creative solutions to count cells based on their colors. We will then delve into more advanced methods, including using VBA (Visual Basic for Applications) to create custom functions for precise color-based counting. Practical examples will illustrate how to apply these techniques to summarize and analyze data efficiently. By the end of this course, you will be equipped with the knowledge and skills to effectively count and analyze colored cells, enhancing your data analysis capabilities. Whether you are a beginner or an advanced user, this course will guide you step-by-step in mastering color counting techniques in Excel. Join us now to leverage the power of color in your data analysis and make more informed decisions based on visual data cues. Start your journey in learning about counting colors in Excel today and transform the way you handle data.
Trends
Video editing with adobe premiere
MS Excel
English skills with books and movies
Learning English Speaking
Create a website with wordPress for beginner
Python programming language
Digital Marketing
Draw Faces for Beginners
Mobile Apps from Scratch
Draw Faces for Beginners
Creating Kids cartoon video fundamentals
Cybersecurity fundamentals for beginners
Important KPIs
Excel Course Basic to Advanced
Getting Started with Python
MICROSOF WORD course
Communication Skills
Primary Health Care Foundations
SEO for business growth for beginners
Excel Power Query in excel for beginners
Recent
English skills with books and movies
Phrasal verbs for Job interviews
Writing in english for beginners
Business english conversations in finance
Formal business english Phrases
Business english stories for beginners
Business English Phrases and Conversations
Business english writing for beginners
Financial english Vocabulary for beginners
Business english meetings for beginners
English grammar for ESL beginners
Job interview in english Preparation
Business english vocabulary for beginners
Business english communication for beginners
Data Science with Python conditions
Reinforcement learning for game development
Machine Learning API development essentials
Building a Forza AI with Python
Deep Learning Projects with Python
Installing OpenCV for Python for beginner