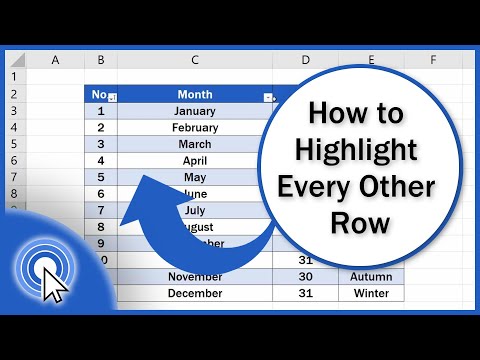
How to Highlight Every Other Row in Excel Quick and Easy
Share your inquiries now with community members
Click Here
Sign up Now
Lesson extensions
Lessons List | 5
Lesson
Comments
Our New Certified Courses Will Reach You in Our Telegram Channel
Join Our Telegram Channels to Get Best Free Courses
Join Now
We Appreciate Your Feedback
Be the First One Review This Course
0 Reviews
Related Courses in Computer Softwares


Course Description
Excel conditional formatting essentials course,
in this course we will learn about Excel conditional formatting essentials, a powerful feature that allows you to automatically apply formatting to cells based on their values. Conditional formatting helps you quickly highlight important information, identify trends, and spot outliers in your data. You will start by understanding the basics of conditional formatting, including how to apply simple rules to cells based on specific criteria. We will guide you through creating and managing various types of rules, such as highlighting cells with values above or below a certain threshold, using color scales to represent data ranges, and applying data bars for visual comparisons. The course will also cover advanced techniques, such as using custom formulas for more complex conditions and combining multiple rules to achieve more sophisticated formatting. Hands-on exercises will provide practical experience, allowing you to apply these techniques to real-world data sets confidently. By the end of this course, you will be proficient in using conditional formatting to enhance your data analysis and presentation, making your Excel spreadsheets more informative and visually appealing. Whether you are a beginner or looking to refine your skills, this course will equip you with the knowledge and tools to master Excel conditional formatting essentials, improving your productivity and data visualization capabilities.
Trends
Speak english fluently with confidence
MS Excel
Building a chatbot with Python
Learning English Speaking
Python programming fundamentals A Z
Generative AI tools for 2024
Creating YouTube videos for beginners
Excel Course Basic to Advanced
Python programming language
Content marketing for beginners
Center of Mass in Physics
Marketing basics for beginners
Phrasal Verbs in daily conversations
Web Development Tools Essentials
Data Science with Python for beginners
AI tools for business for beginners
Coding tools for developers
Google analytics 4 for beginners
Tools and toolbar in Photoshop for beginners
WordPress Complete Course in Hindi
Recent
Arabic numbers for beginners
Rating arabic handwriting techniques
Form verbal sentences in arabic
Arabic sentence structure for beginners
Phrasal Verbs in daily conversations
Speak english fluently with confidence
Rules for plural forms of irregular nouns
English slang dictionary for fluency
English idioms for everyday conversations
Native english vocabulary for fluency
Teach reading with Phonics for beginners
English speaking confidence techniques
Business english communication skills
American english conversation for beginners
Advanced english listening and vocabulary
English prepositions for beginners
Improve english Pronunciation for beginners
PGP in data science and engineering
Building a chatbot with Python
Python programming fundamentals A Z