Skip Dates in Excel Charts ignore gaps and blank cells
Share your inquiries now with community members
Click Here
Sign up Now
Lesson extensions
Lessons List | 48
Lesson


Show More
Lessons
Comments
Our New Certified Courses Will Reach You in Our Telegram Channel
Join Our Telegram Channels to Get Best Free Courses
Join Now
We Appreciate Your Feedback
Be the First One Review This Course
0 Reviews
Related Courses in Computer Softwares


Course Description
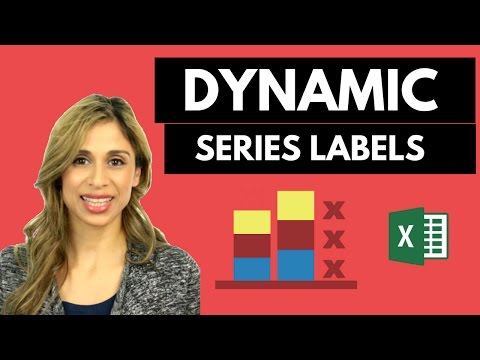
Excel dynamic series labels course,
in this course we will learn about Excel dynamic series labels, a powerful feature that enhances data visualization in charts by automatically updating labels as data changes. Dynamic series labels in Excel make your charts more interactive and informative, ensuring that the information displayed is always accurate and up-to-date. We will start by understanding the basics of setting up dynamic data ranges using functions like OFFSET and COUNTA. You will learn how to create and apply dynamic names to these ranges, which will serve as the basis for your dynamic labels. The course will guide you through the process of linking these dynamic ranges to chart series and customizing the labels to reflect real-time data changes. We will explore practical applications, such as tracking financial trends, monitoring project progress, and creating interactive dashboards. Through hands-on exercises and real-world examples, you will gain the skills needed to implement dynamic series labels in your own charts, improving both the clarity and effectiveness of your data presentations. By the end of this course, you will be proficient in using Excel dynamic series labels to create more insightful and visually appealing charts, making your reports more compelling and easier to understand. This course is perfect for anyone looking to enhance their Excel skills and improve their data visualization techniques.
Trends
MS Excel
Learning English Speaking
WiFi hacking
Adobe illustrator tools for designers
Ethical Hacking
Python programming language
Mobile Apps from Scratch
Logo Programming for beginners
Python in Hindi
Excel Course Basic to Advanced
Cybersecurity
Complete WIFI Hacking Course Beginner to Advanced
Graphic design rules for beginners
Ethical Hacking
Embedded Systems ES
Accounting Finance course
Web Design for Beginners
Building graphic design portfolio from scratch
Downloading and installing tux paint for kids
Microsoft Excel How to course
Recent
Adobe illustrator tools for designers
Graphic design rules for beginners
Isometric design in illustrator for beginners
Psychology in graphic design for beginners
Test graphic design skills for beginners
Plugins for adobe Illustrator designers
Logo design tools in illustrator for beginners
Illustrator keyboard shortcuts for beginners
Building graphic design portfolio from scratch
Audacity download and installation for beginners
Downloading and installing tux paint for kids
Building a race game in scratch for beginners
Sharing links in edmodo for beginners
Google sheets dynamic chart techniques
Building a CV website from scratch
Designing logos in google drawings for beginners
Converting PDF to google docs for beginners
Google slides text masking essentials
Inserting images in microsoft word for beginners
Hosting images on google drive for beginners