Line Graph Company Profit DI Reasoning Part 03 Bharath Kumar
Share your inquiries now with community members
Click Here
Sign up Now
Lesson extensions
Lessons List | 25
Lesson
Comments
Our New Certified Courses Will Reach You in Our Telegram Channel
Join Our Telegram Channels to Get Best Free Courses
Join Now
We Appreciate Your Feedback
Be the First One Review This Course
0 Reviews
Related Courses in Computer Science


Course Description
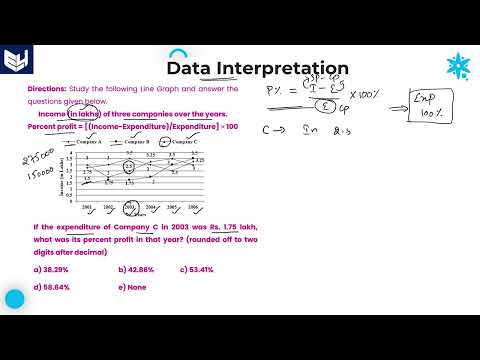
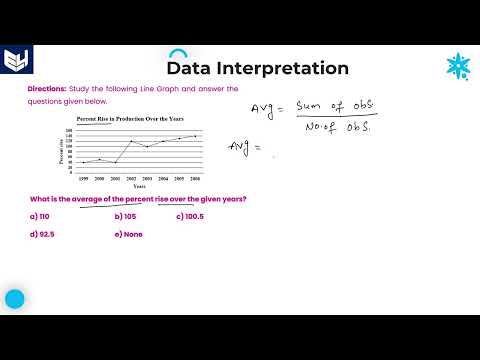
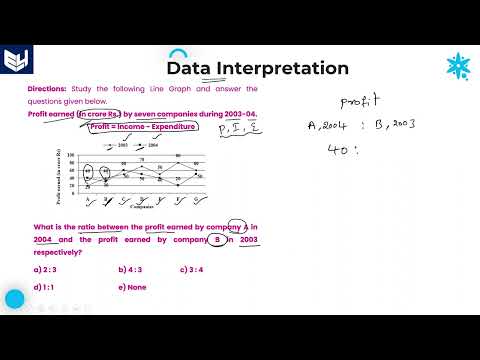
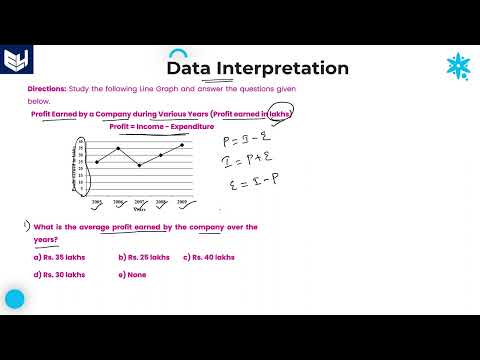
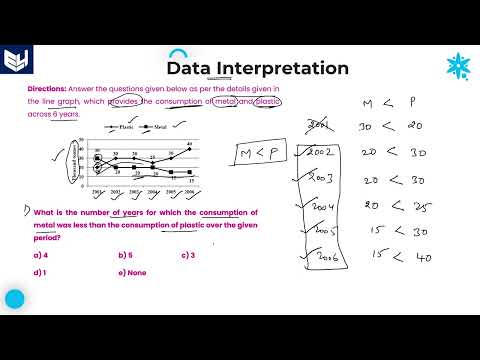
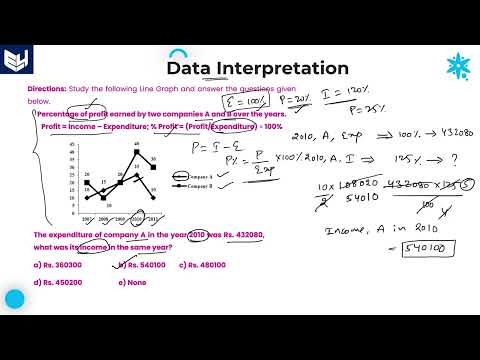
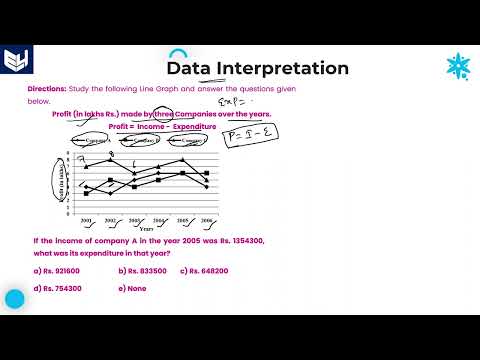
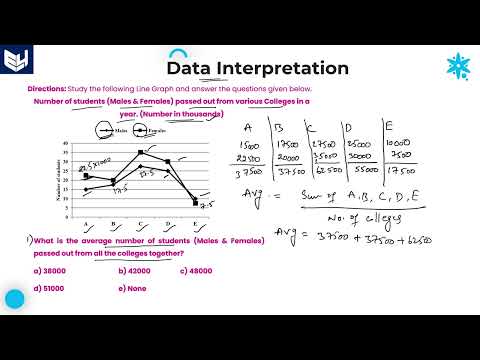
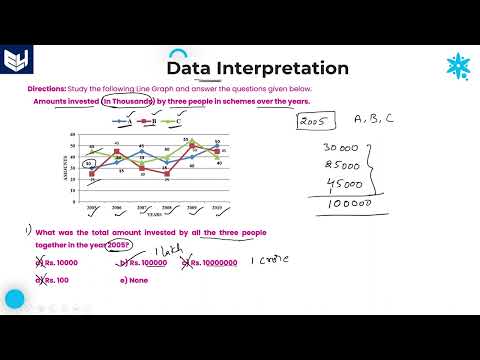
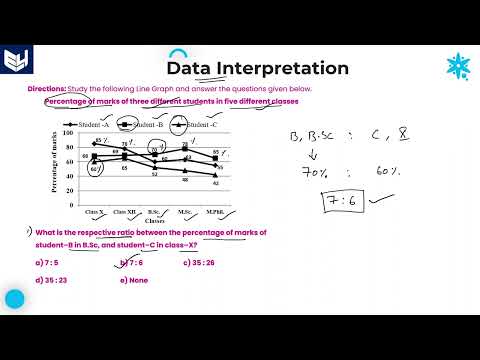
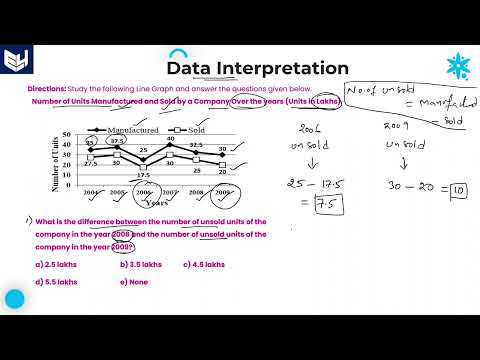
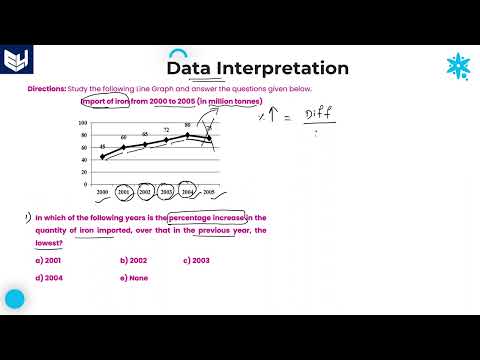
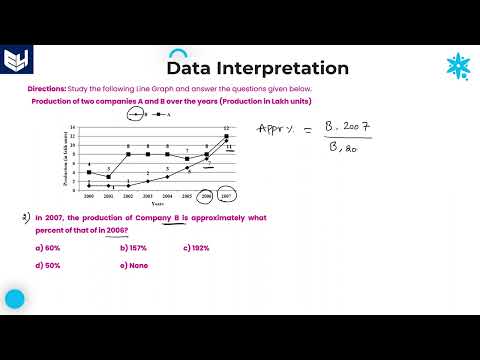
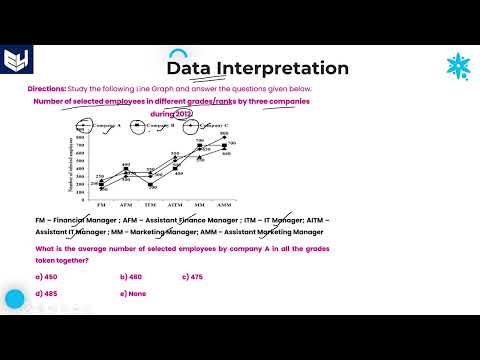
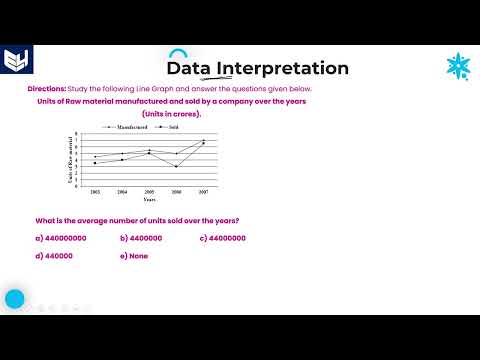
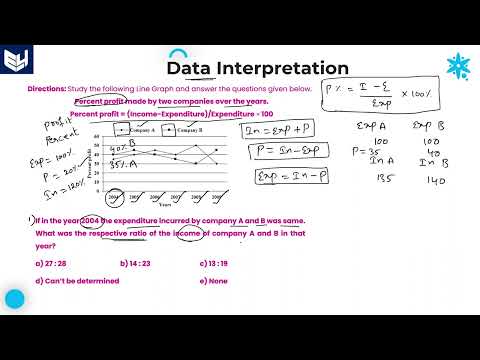
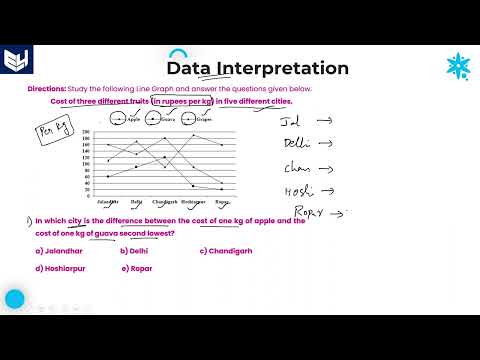
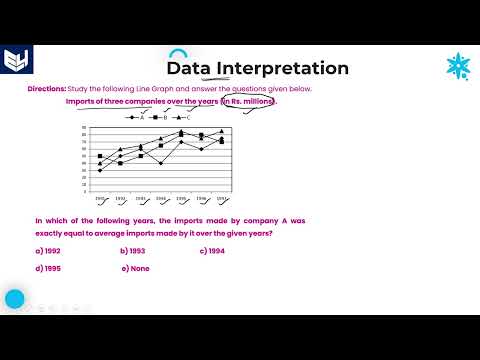
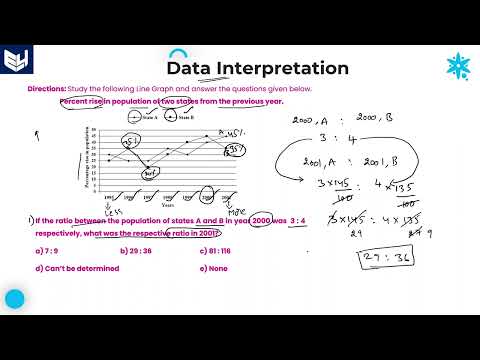
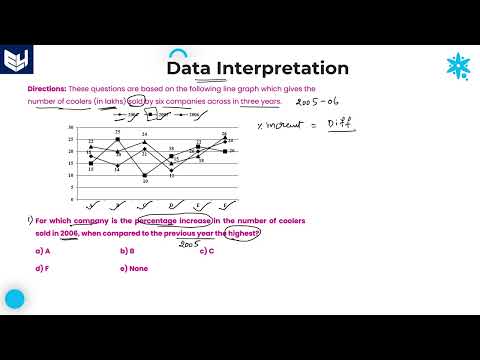
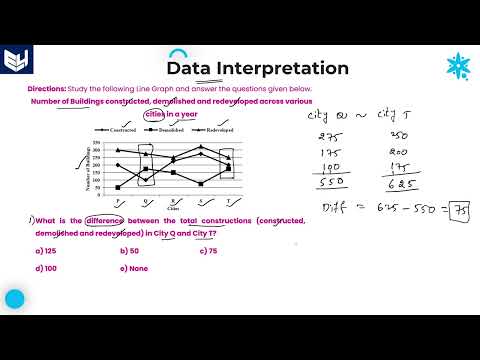
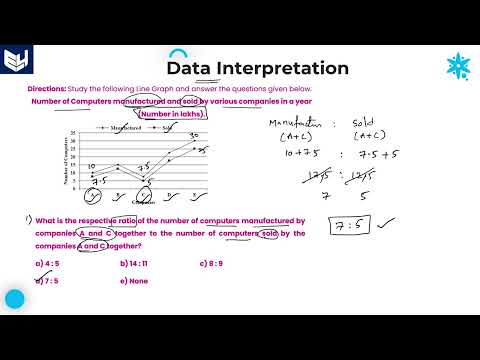
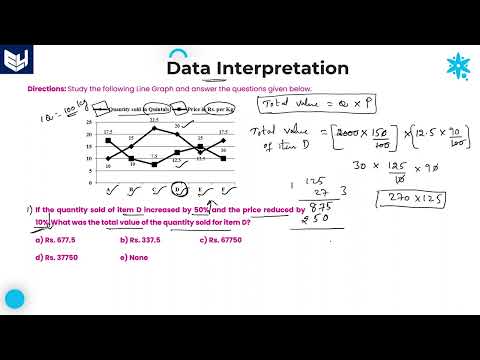
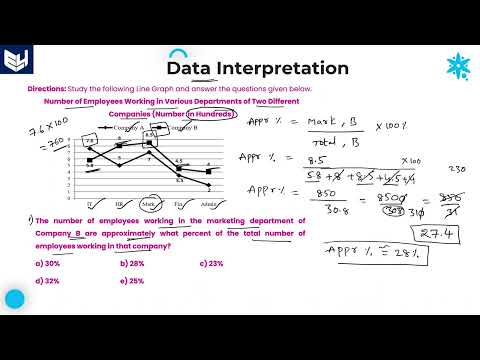
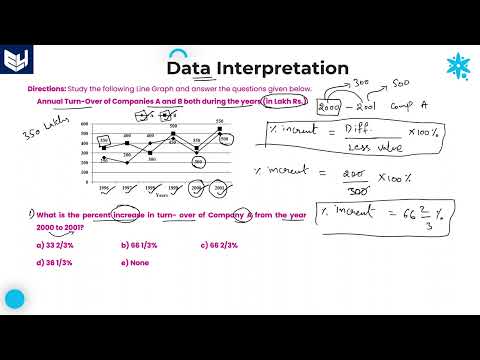
Data interpretation with line graphs course,
in this course we will learn about Data Interpretation with Line Graphs. This course offers a comprehensive introduction to the techniques and skills required to accurately interpret data presented in line graphs. Starting with the basics, we will explore how to understand the axes of a line graph, including identifying the independent and dependent variables. You will learn how to read and analyze data points, as well as understand the significance of the lines connecting these points to reveal trends, patterns, and relationships over time or across different categories. Through practical examples and exercises, you will gain hands-on experience in identifying key insights from line graphs, such as detecting increases, decreases, and stable periods. The course will also cover advanced topics, such as comparing multiple data sets within a single graph and understanding the implications of various data patterns. By the end of this course, you will have the skills necessary to effectively use line graphs for data analysis, enabling you to make informed decisions based on visual data representations. This course is ideal for students, professionals, and anyone interested in enhancing their data analysis capabilities through the use of line graphs.
Trends
Video editing with adobe premiere
Learning English Speaking
Control Systems CS
MS Excel
Create a website with wordPress for beginner
Python programming language
Mobile Apps from Scratch
Ethical Hacking
Digital Marketing
Data Science with Python conditions
Excel Course Basic to Advanced
AUTOMATA THEORY
WiFi hacking
Marketing
Human Psychology
SEO for business growth for beginners
The Complete Python Programming Full Course
Human Resource Management in Public Service for mangers
Complete WIFI Hacking Course Beginner to Advanced
Android Photo editing app development
Recent
Data Science with Python conditions
Reinforcement learning for game development
Machine Learning API development essentials
Building a Forza AI with Python
Deep Learning Projects with Python
Installing OpenCV for Python for beginner
Video editing with adobe premiere
Mastering adobe Illustrator CC basics
Create a website with wordPress for beginner
AI deep reinforcement Learning in Python
Kotlin programming essentials bootcamp
Brainstorming on data science
Python mySQL database connection
Model deployment on unix for beginners
Data Science knowledge test
Data science mock interview basics
Deep Learning interview questions
VIF application in python for beginners
Data science basics quiz
NLP and generative AI for beginners