Creating Data Visualization with D3 Normal Tree Visualization |packtpub com
Hide All Ads - Subscribe Premium Service Now
Share your inquiries now with community members
Click Here
Sign up Now
Lessons List | 5
Lesson
Comments
Our New Certified Courses Will Reach You in Our Telegram Channel
Join Our Telegram Channels to Get Best Free Courses
Join Now
We Appreciate Your Feedback
Be the First One Review This Course
0 Reviews
Related Courses in Programming


Course Description
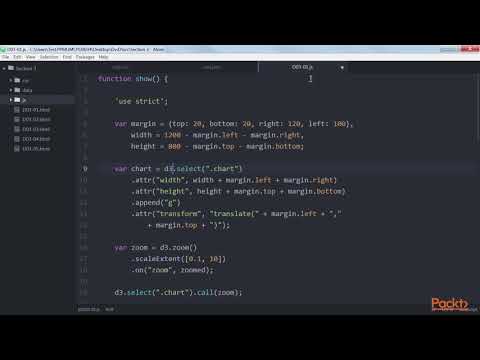
D3 or Data-Driven Documents is an open-source JavaScript library and is undoubtedly the most influential tool for creating custom interactive data visualizations in the web browser using SVG, HTML and CSS .
Trends
Learning English Speaking
Formation efficace à l écoute de l
MS Excel
Python programming language
Excel Course Basic to Advanced
Make AI for beginners
Web Design for Beginners
English Language
French
Magento Formation Français
Content Marketing
English Grammar for Beginners
Communication Skills
Power BI UI UX design roadmap
Every Photoshop
Create a custom List in excel
Artificial Intelligence For Beginners
Photo Editing
Critical Skills
Основы after effects
Recent
Power BI Fundamentals
Make AI for beginners
Power BI
Power BI UI UX design roadmap
Artificial intelligence tools
Create a custom List in excel
Spatie laravel media library
Install laravel livewire
Install Laravel 8 on windows 10
Laravel 8 admin panel
Laravel statamic CMS website
Laravel URL shortener
Laravel 8 API
Laravel livewire employees management
Employees management application with laravel
Vue js 3 fundamentals
Laravel livewire business listing
Laravel inertiaJS movie app
Vue router 4
Create a movie website with laravel Livewire