Data Visualization with Tableau Working on Excel Data| packtpub com
Share your inquiries now with community members
Click Here
Sign up Now
Lessons List | 9
Lesson


Comments
Our New Certified Courses Will Reach You in Our Telegram Channel
Join Our Telegram Channels to Get Best Free Courses
Join Now
We Appreciate Your Feedback
95 Reviews

Alluru Ishitha
Josemaria Mbata
Aditya Thakur
Aditi Kiwale
Show More Reviews
Related Courses in Programming


Course Description
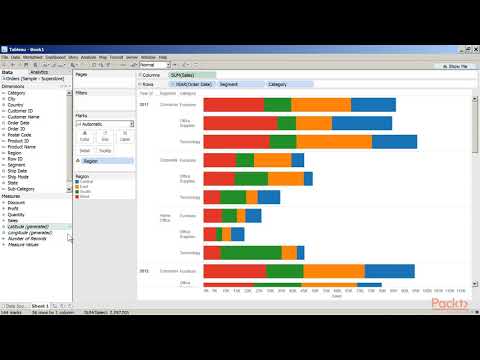
Tableau is a very effective tool to create interactive data visualizations very quickly. It is very simple and user-friendly. Tableau can create complex graphs giving a similar feel as the pivot table graphs in Excel. Moreover, it can handle a lot more data and quickly provide calculations on datasets .
Trends
MS Excel
WiFi hacking
Adobe illustrator tools for designers
Learning English Speaking
C Programming Language
Python programming language
Ethical Hacking
PMP Certification
Artificial Intelligence
Digital Marketing
Complete WIFI Hacking Course Beginner to Advanced
Mobile Apps from Scratch
Full Stack Web Development
Back End Developer Learning Path course
Python in Hindi
Data Visualization with Tableau
AI Writing tools in google docs for beginners
Free Full stack Course
The Complete Python Programming Full Course
Accounting Finance course
Recent
Rock sitting dance workout for beginners
Fat Burning home workout For beginners
Home weight loss workout For women
Cardio Kickboxing HIIT for beginners
HIIT cardio walking workout at home
Gospel cardio dance workout at home
Upper body cardio weights for beginners
Legs workout with dumbbell for beginners
Cardio workout for beginners
Hotel HIIT legs workout for beginners
Cool down stretch workouts at home
Cardio boxing workout at gym
Legs and abs workout at home
Cardio Kickboxing workouts at gym
Pilates and barre inspired workouts at gym
Intense cardio HIIT workouts at gym
Knockout cardio workouts for beginners
Tucked abs workout at home
Hamstrings tempo workout at home
Dumbbell cardio HIIT workouts at gym