Data Visualization in Python by Examples Setting Up and Getting Started with ggplot| packtpub com
Share your inquiries now with community members
Click Here
Sign up Now
Lessons List | 4
Lesson
Comments
Our New Certified Courses Will Reach You in Our Telegram Channel
Join Our Telegram Channels to Get Best Free Courses
Join Now
We Appreciate Your Feedback
2 Reviews

Vishwajeet Sunil Shelke

ADEL AIT BENZEKRI
Show More Reviews
Related Courses in Programming


Course Description
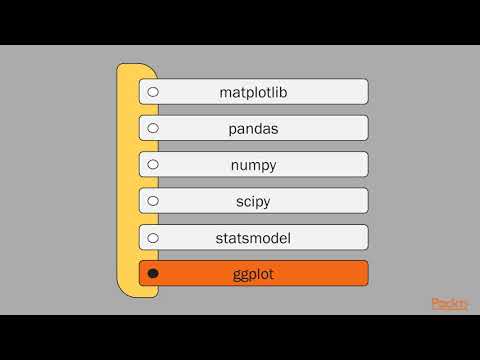
Matplotlib and Seaborn are python libraries that are used for data visualization. They have inbuilt modules for plotting different graphs. While Matplotlib is used to embed graphs into applications, Seaborn is primarily used for statistical graphs .
Trends
Web Design for Beginners
Graphic Design Basics
Accounting
Biology
Web Design 101 Free Full Course
Web Design Using HTML CSS
Logistics and Supply Chain Management
Graphic design tools for beginners
Advanced Logo design methods
UX design career in 2025
Best zoology books
Figma for UX UI design
Figma Signing Up and Signing In
Logic circuit design fundamentals
Logo Design
Graphic Design | Photoshop
Make money as a freelance designer
Python Basics in Arabic
French
Financial Accounting
Recent
Bioinformatics basics
Bioinformatics databases
Vitamin A to Z tablets
Best zoology books
Best cream for piles pain
Laser surgery for piles
Best cream for piles
Anal fissure treatment
Best antibiotics for diseases
Antibodies structure
Macrophage structure
Drosophila genetics
Diagnostic tests
Bioinformatics
Genetics
Gene therapy
Kidney structure
DNA replication and types
Bacterial cell structure
Parasite structure