Learning Data Visualization Data Types Overview | packtpub com
Share your inquiries now with community members
Click Here
Sign up Now
Lessons List | 4
Lesson
Comments
Our New Certified Courses Will Reach You in Our Telegram Channel
Join Our Telegram Channels to Get Best Free Courses
Join Now
We Appreciate Your Feedback
16 Reviews

Eswar Gadamsetty

Sahana K S
Yashiga
ABDULMEJID
Show More Reviews
Related Courses in Programming


Course Description
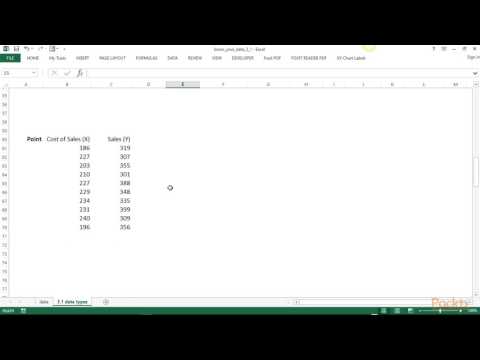
Data visualization is the graphical representation of information and data. By using visual elements like charts, graphs, and maps, data visualization tools provide an accessible way to see and understand trends, outliers, and patterns in data.
Trends
Web Design for Beginners
Logistics and Supply Chain Management
Graphic Design Basics
Accounting
Python Basics in Arabic
Biology
Web Design 101 Free Full Course
Web Design Using HTML CSS
CSCA certification exam strategies
UX design career in 2025
Best zoology books
React Hooks for Beginners
French
Adobe Illustrator Techniques
Logic circuit design fundamentals
Advanced Logo design methods
Figma for UX UI design
ChatGPT for Developers
Graphic design tools for beginners
Micro and macro economics for beginners
Recent
Bioinformatics basics
Bioinformatics databases
Vitamin A to Z tablets
Best zoology books
Best cream for piles pain
Laser surgery for piles
Best cream for piles
Anal fissure treatment
Best antibiotics for diseases
Antibodies structure
Macrophage structure
Drosophila genetics
Diagnostic tests
Bioinformatics
Genetics
Gene therapy
Kidney structure
DNA replication and types
Bacterial cell structure
Parasite structure