Building Interactive Data Visualizations with D3 js SVG and Other Image Formats | packtpub com
Share your inquiries now with community members
Click Here
Sign up Now
Lessons List | 9
Lesson
Comments
Our New Certified Courses Will Reach You in Our Telegram Channel
Join Our Telegram Channels to Get Best Free Courses
Join Now
We Appreciate Your Feedback
Be the First One Review This Course
0 Reviews
Related Courses in Programming


Course Description
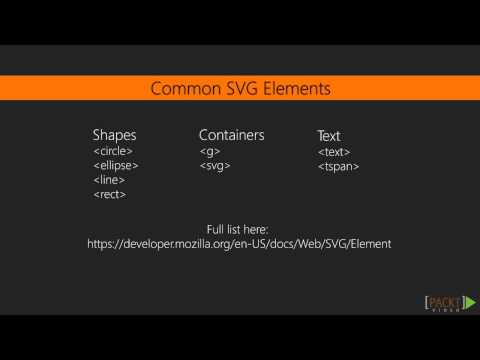
D3 or Data-Driven Documents is an open-source JavaScript library and is undoubtedly the most influential tool for creating custom interactive data visualizations in the web browser using SVG, HTML and CSS.
Trends
Digital marketing career for beginners
Data Analytics with Excel
Web Development For Beginners
ISTQB automotive software tester 2024
Digital marketing in 2025
Building foundation construction fundamentals
Graphics card repair techniques
Video editing in Premiere Pro for beginners
Creative business card with CorelDraw
Bidding strategies in google Ads
Mastering Articulation techniques
React GraphQL Starter Kit
PHP Application with Login
Networking basics for beginners
Photoshop Tools
IT basics and Computer Science
Practical Reinforcement Agents
Data definition language fundamentals
mTOR Signaling Pathway effects
Calculating land area methods
Recent
Bioinformatics basics
Bioinformatics databases
Vitamin A to Z tablets
Best zoology books
Best cream for piles pain
Laser surgery for piles
Best cream for piles
Anal fissure treatment
Best antibiotics for diseases
Antibodies structure
Macrophage structure
Drosophila genetics
Diagnostic tests
Bioinformatics
Genetics
Gene therapy
Kidney structure
DNA replication and types
Bacterial cell structure
Parasite structure