ggplot2 and Shiny Tutorial Designing an Interactive Dashboard | packtpub com
Share your inquiries now with community members
Click Here
Sign up Now
Lessons List | 4
Lesson

Comments
Our New Certified Courses Will Reach You in Our Telegram Channel
Join Our Telegram Channels to Get Best Free Courses
Join Now
We Appreciate Your Feedback
Be the First One Review This Course
0 Reviews
Related Courses in Programming


Course Description
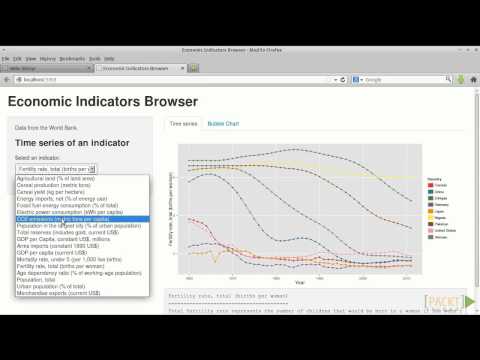
The best way to build an interactive bubble chart from R is through the plotly library. If you know how to make a ggplot2 chart, you are 10 seconds away to rendering an interactive version= just call the ggplotly() function, and you're done. ← this chart is interactive: hover, drag, zoom, export and more.
Trends
Embedded Systems ES
Android Hacking
MS Excel
Adobe illustrator tools for designers
Learning English Speaking
C Programming language basics For beginners
Creating recorded macros in excel for beginners
Basic Mathematics by Serge Lang
Python programming language
Mobile Apps from Scratch
Complete WIFI Hacking Course Beginner to Advanced
Python in Hindi
Downloading and installing tux paint for kids
Ethical Hacking
Learn SEO Complete SEO Course
Spanish Lessons for Beginner Learners
HP Repair
Excel VBA programming for beginners
Excel Course Basic to Advanced
Graphic design rules for beginners
Recent
Adobe illustrator tools for designers
Graphic design rules for beginners
Isometric design in illustrator for beginners
Psychology in graphic design for beginners
Test graphic design skills for beginners
Plugins for adobe Illustrator designers
Logo design tools in illustrator for beginners
Illustrator keyboard shortcuts for beginners
Building graphic design portfolio from scratch
Audacity download and installation for beginners
Downloading and installing tux paint for kids
Building a race game in scratch for beginners
Sharing links in edmodo for beginners
Google sheets dynamic chart techniques
Building a CV website from scratch
Designing logos in google drawings for beginners
Converting PDF to google docs for beginners
Google slides text masking essentials
Inserting images in microsoft word for beginners
Hosting images on google drive for beginners