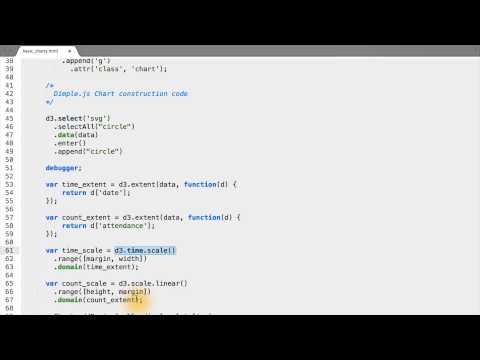
Creating Time and Attendance Scales Data Visualization and D3 js
Share your inquiries now with community members
Click Here
Sign up Now
Lessons List | 297
Lesson
Show More
Lessons
Comments
Our New Certified Courses Will Reach You in Our Telegram Channel
Join Our Telegram Channels to Get Best Free Courses
Join Now
We Appreciate Your Feedback
Be the First One Review This Course
0 Reviews
Related Courses in Programming


Course Description
D3 or Data-Driven Documents is an open-source JavaScript library and is undoubtedly the most influential tool for creating custom interactive data visualizations in the web browser using SVG, HTML and CSS .
Trends
Web Design for Beginners
Speak english fluently with confidence
MS Excel
Learning English Speaking
Building a chatbot with Python
Python programming fundamentals A Z
Creating YouTube videos for beginners
Draw Faces for Beginners
Content marketing for beginners
Trading Analytics basics
Embedded Systems ES
Computer Basics
Excel functions for data analysis
Photo Editing
Cyber Security for Beginners | Edureka
The Basics Of Real Estate
A1 Learn German for beginners
Phrasal Verbs in daily conversations
Tools and toolbar in Photoshop for beginners
Excel Course Basic to Advanced
Recent
Flowback Phase in oil and gas
Oil and gas emissions solutions
Back pressure regulator working principle
Liquid level switch CUA maintenance
Lever operated mechanical dump valve
Oil and gas basics
Electric actuator installation for oil gas
Artificial lifts in Oil and gas
High pressure pilot systems
Oil and gas storage tank protection
Energy exchange glycol Pumps fundamentals
Arabic numbers for beginners
Rating arabic handwriting techniques
Form verbal sentences in arabic
Arabic sentence structure for beginners
Phrasal Verbs in daily conversations
Speak english fluently with confidence
Rules for plural forms of irregular nouns
English slang dictionary for fluency
English idioms for everyday conversations