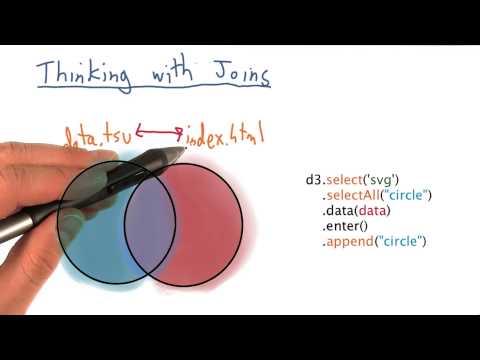
Thinking with Venn Diagrams Data Visualization and D3 js
Share your inquiries now with community members
Click Here
Sign up Now
Lessons List | 297
Lesson
Show More
Lessons
Comments
Our New Certified Courses Will Reach You in Our Telegram Channel
Join Our Telegram Channels to Get Best Free Courses
Join Now
We Appreciate Your Feedback
Be the First One Review This Course
0 Reviews
Related Courses in Programming


Course Description
D3 or Data-Driven Documents is an open-source JavaScript library and is undoubtedly the most influential tool for creating custom interactive data visualizations in the web browser using SVG, HTML and CSS .
Trends
Speak english fluently with confidence
MS Excel
French A1 For beginners
Learning English Speaking
How to Start Business
Create an instagram business page 2020
matrix multiplication in javascrip
house wiring basics for beginners
crack software
IT Careers Fundamentals
BroadcastReceiver Programming
Test graphic design skills for beginners
Hands On Deep Learning for Computer
Content Writing Techniques
Generative AI tools for 2024
Business growth essentials
Artificial Intelligence in 3 Hours
Graphic design rules for beginners
Flask web development essentials
Java desde
Recent
Oil and gas Production equipment
Low Pressure Control Valves techniques
Oil and gas industry knowledge
Oil and gas equipment product naming
Oil and gas industry fundamentals
Electric glycol Pump maintenance
Back pressure regulator working principle
High Pressure control valve repair
Flowback Phase in oil and gas
Oil and gas emissions solutions
Back pressure regulator working principle
Liquid level switch CUA maintenance
Lever operated mechanical dump valve
Oil and gas basics
Electric actuator installation for oil gas
Artificial lifts in Oil and gas
High pressure pilot systems
Oil and gas storage tank protection
Energy exchange glycol Pumps fundamentals
Arabic numbers for beginners