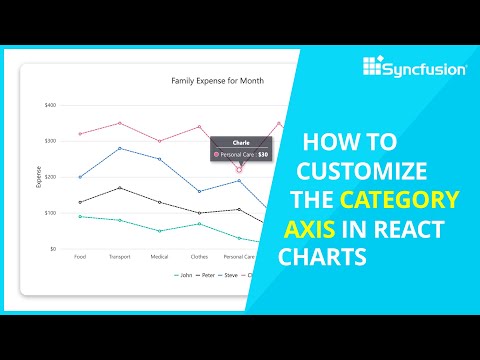
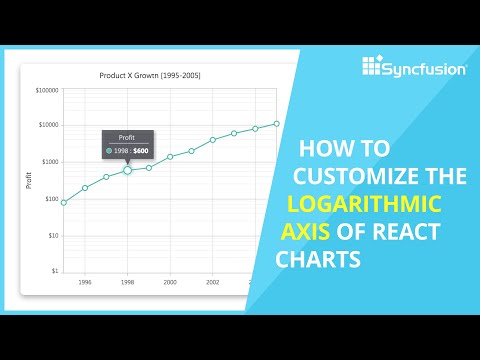
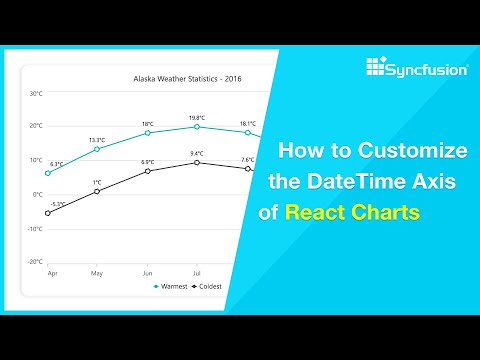
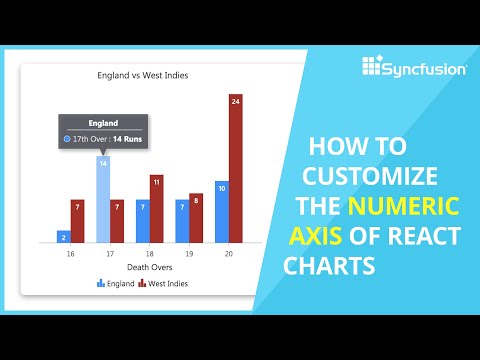
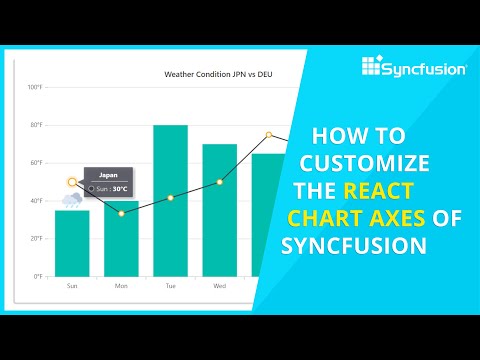
How to Customize the Tooltips in React Charts of Syncfusion
Share your inquiries now with community members
Click Here
Sign up Now
Lessons List | 11
Lesson

Comments
Our New Certified Courses Will Reach You in Our Telegram Channel
Join Our Telegram Channels to Get Best Free Courses
Join Now
We Appreciate Your Feedback
Be the First One Review This Course
0 Reviews
Related Courses in Programming


Course Description
Google Charts is a free Javascript library that allows you to visualize data in many types of charts and graphs. It's very useful and easy to use in your projects. In this tutorial, we'll see how to use Google Charts in React by creating a simple React app with Create React App (CRA).
Trends
Calendar design in Photoshop for beginners
Ethical Hacking
Learning English Speaking
Installing Fonts on Windows Laptop
The Complete Python Programming Full Course
MS Excel
British english reading for beginners
Digital Electronics
NET Core Microservices
Wall calendar in coreldraw for beginners
Technical Analysis for Beginners
Mobile Apps from Scratch
Nikon tutorials and tips
Node JS with Mongoose ODM
Logo Design
Python programming language
Phrenology in Psychology
Magento Formation Français
Multiplying Fractions in Algebra
Creating Google Ads account for beginners
Recent
Installing Fonts on Windows Laptop
Wall calendar in coreldraw for beginners
Illustrator business card design for beginners
Calendar design in Photoshop for beginners
Creating Google Ads account for beginners
Installing wordPress step by step
Converting PDF files to excel format
Uploading files in google drive 2023
Updating drivers on windows 11 for beginners
Changing mouse sensitivity in windows 10 or Laptop
Installing VLC media player in windows 10
Split Screen on macBook for beginners
Saving Locations in google maps for beginners
The complete Android Application Development Course in Hindi
WordPress Complete Course in Hindi
Swift Programming For IOS From Scratch Swift Programming Tutorial For Beginners
R Programming from Scratch
Adding shortcuts in google chrome for beginners
Data Structure using C from Scratch Data Structure Full Course C 2024
Creating aYouTube channel for beginners