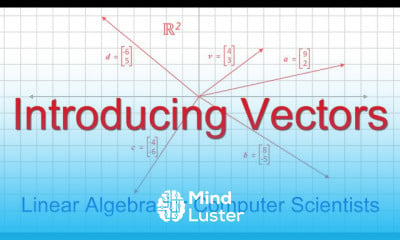
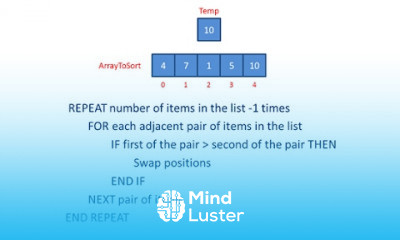
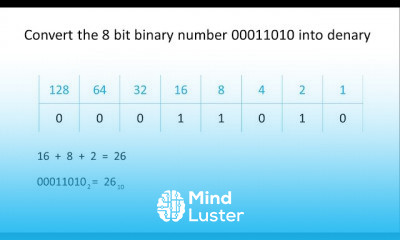
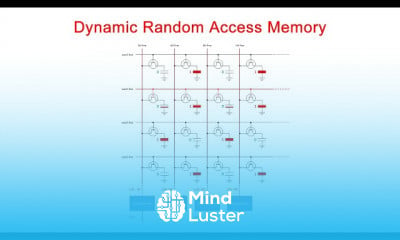
3d visualization industrial animation 3d infographic of industrial facilities
Share your inquiries now with community members
Click Here
Sign up Now
Lessons List | 10
Lesson
Comments
Related Courses in Computer Science
Course Description
Data visualization (often abbreviated data viz) is an interdisciplinary field that deals with the graphic representation of data. It is a particularly efficient way of communicating when the data is numerous as for example a time series.
Of course, one of the best ways to understand data visualization is to see it. What a crazy concept! With public data visualization galleries and data everywhere online, it can be overwhelming to know where to start. We’ve collected 10 of the best examples of data visualization of all time, with examples that map historical conquests, analyze film scripts, reveal hi…
Data visualization is the graphical representation of information and data. By using visual elements like charts, graphs, and maps, data visualization tools provide an accessible way to see and understand trends, outliers, and patterns in data.
Trends
Graphic design tools for beginners
Web Design for Beginners
Advanced Logo design methods
Accounting Finance course
Graphic Design Basics
Best zoology books
Customizing type for logos
Logo Design
UX design career in 2025
Graphic Design | Photoshop
Accounting
Figma mobile UI design essentials
Accounting and Bookkeeping fundamentals
Web Design 101 Free Full Course
Figma for UX UI design
Web Design Using HTML CSS
Financial Accounting
Figma Signing Up and Signing In
Master graphic design techniques
Xcode UI design for beginners
Recent
Bioinformatics basics
Bioinformatics databases
Vitamin A to Z tablets
Best zoology books
Best cream for piles pain
Laser surgery for piles
Best cream for piles
Anal fissure treatment
Best antibiotics for diseases
Antibodies structure
Macrophage structure
Drosophila genetics
Diagnostic tests
Bioinformatics
Genetics
Gene therapy
Kidney structure
DNA replication and types
Bacterial cell structure
Parasite structure


