
 71 Lessons
 178 Students


Oslouis Almonor
Excellent course
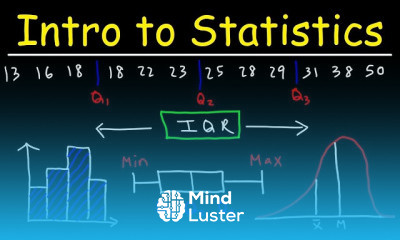
Statistics is a mathematical body of science that pertains to the collection, analysis, interpretation or explanation, and presentation of data, or as a branch of mathematics. Some consider statistics to be a distinct mathematical science rather than a branch of mathematics.
 To Register in Course you have to watch at least 30 Second of any lesson
 Master data collection techniques and design effective surveys for accurate statistical analysis
Apply descriptive statistics to summarize and visualize data sets for clear insights
Perform inferential statistical tests to draw valid conclusions from sample data
Utilize probability theory to assess risks and make data-driven decisions in real-world scenarios
Interpret statistical results to support business, scientific, or social research objectives
Use statistical software tools for data analysis, visualization, and reporting
Identify and correct common errors in data collection, analysis, and interpretation processes
Communicate statistical findings effectively to non-technical stakeholders and decision-makers
Implement regression and correlation analysis to explore relationships between variables
Design experiments and analyze results to optimize processes and improve outcomes
Evaluate the reliability and validity of statistical data and methods used
Apply Bayesian and frequentist approaches for advanced statistical inference
Develop skills to handle large datasets and perform big data analytics efficiently
Understand ethical considerations and best practices in statistical research and data handling
71 Lessons • 18 h 36 m total

 You must have an
Account
on the platform.
Complete all lessons.
Watch at least 50% of Lesson Duration.
Get your Certificate free 🎉 !
4.8
 (100 reviews)
Overall rating

Be the First One Review This Course
Excellent course

it was very nice lecture. before i seen this lecture i have a lot of confusion in stem and leaf, diffrence between statistic and parameter, probability portion like conditional probability and bayes theorem etc. after seing this lecture in numerical form my all confusion is to be clear. this is a wonderful class. my basic fundamental portion in statistics is clear. thank you sir.
Good course
Excellent
super

I got this course more knowledge about statistics

Good

Very well explain

Statistics is a mathematical body of science that pertains to the collection, analysis, interpretation or explanation, and presentation of data, or as a branch of mathematics. Some consider statistics to be a distinct mathematical science rather than a branch of mathematics.
Experience the full power of Mindluster with Premium.
No distractions, just pure education.
Cancel your subscription anytime